Thinking Big
In a recent survey asking corporations to name the challenges they face regarding Big Data, most cited ‘limited availability of skilled employees’ as the number one problem. The Faculty of Science is doing its part to redress that shortage with the introduction of a new major in Decision Analytics.

“We have put together a highly comprehensive major that integrates computer technologies and statistical techniques to analyse data and formulate data-driven strategies,” said Dr Philip LH Yu, Associate Professor in the Department of Statistics and Actuarial Science. “We want to equip students with the skills and expertise to leverage and manage Big Data in real time.”
Big Data means information sets that grow so large or complex that traditional data processing applications are inadequate. Challenges include capture, storage, search, sharing, analytics and visualisation.
“The programme is interdisciplinary, combining maths, statistics and computer science – the data-handling side of it rather than the chips or hardware aspects,” said Dr Yu. “It gives our students knowledge in handling and analysing Big Data so they can identify patterns and structures.”
Rapid developments in computer and data storage technologies mean the fundamental paradigms of classical data analysis have become ripe for change. “We aim to teach analytics techniques that will help students work smarter by revealing underlying structure and relationships in large amounts of data,” he said. “And to teach them how to make decisions based on their analysis of the data.”
Dr Yu said that it all begins with data collection. Before technology, data were gathered by doing surveys or experiments. Data size tended to be limited, speed of analytics was slow and analysis very structured. Now data are collected on a massive scale. The data can be unstructured, (that is, it does not have to be complete as it is possible to handle what is missing), and the analysis can be done in real-time, or, if not, certainly a lot faster than before.
“The major covers how to grab data from the web, and to work out if those data are representative,” said Dr Yu. To illustrate the difference between old data and Big Data, he cites the example of taking photos. “In the old days, you bought a roll of film, and because it was relatively expensive you would take one shot of a scene, thinking about it carefully before pressing the shutter. You would have one observation of every scene. Now, with digital cameras and mobile phones, people take dozens of shots of the same scene. Therefore, it’s essential to understand what data you are collecting. Is it one viewpoint or 1,000 viewpoints of the same scene? Just because the amount of information collected is big, does not necessarily mean it’s useful.”

![]() We aim to teach analytics techniques that will help students work smarter by revealing underlying structure and relationships in large amounts of data.
We aim to teach analytics techniques that will help students work smarter by revealing underlying structure and relationships in large amounts of data. ![]()
Dr Philip LH Yu
Mining techniques
Now, data collection can be instant via wearable devices. It can also be long-term, for example health surveillance can be done over decades. “People are volunteering to wear devices that will monitor their health continuously over many years. This may help us make advances in our understanding of how diseases such as cancer develop. We did a student project where we used travel data to look at visitor arrivals from Taiwan, and from that to forecast likely figures in the coming months,” said Dr Yu. The analysis was made based on figures from the Hong Kong Tourism Board and by searching for key words in Google such as Hong Kong visa, Hong Kong hotels and Ocean Park.
“For visitors from Taiwan, these data sources were fine, but I point out to students that they must be aware of relevant outside factors when working out if a data source is appropriate. For instance, had we been trying to monitor visitors from China, we would not have been able to do it in this way as they can’t access Google on the Mainland.
“We have a saying – ‘garbage in, garbage out’– which means if the original data are no good, the analysis cannot be any good. You must be sure that the information you are gathering is representative and suitable to the task.”
The major covers areas such as analysis of textual data, as well as data visualisation, or presenting information in ways that are instantly understandable. “Even the way data are presented is different now. Before you would draw a graph,” said Dr Yu. “With Big Data you need more. One answer is infographics, data visualisation is another.”
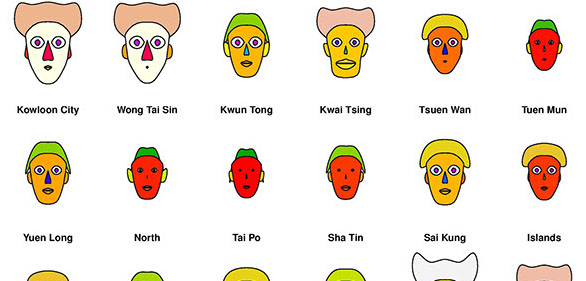
He recently published an article in the Economic Journal in which the 18 districts of Hong Kong were depicted using parts of the head to represent different data. For example, the face represented median monthly household income, the mouth was average household size and the nose was the percentage of persons with secondary education and above. The resulting image meant you could see at a glance the basic demographic of areas of Hong Kong.
“Big Data analytics is an essential tool in today’s world,” said Dr Yu. “And the reason we use ‘decision’ in the major’s title is because we want to equip our students with the means not only to understand and analyse, but also make decisions based on those analyses. How can the information be applied in policy-making, marketing, forecasting?”

Dr Yu depicts the basic demographic of areas of Hong Kong with parts of the head – the face represents median monthly household income, the mouth stands for average household size and the nose is the percentage of persons with secondary education and above.

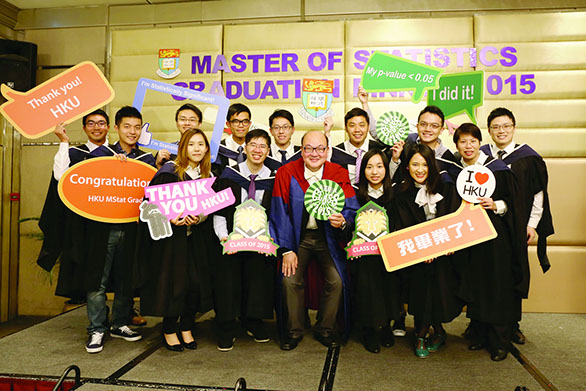
Dr Yu (centre) with his Master of Statistics students.
Next

