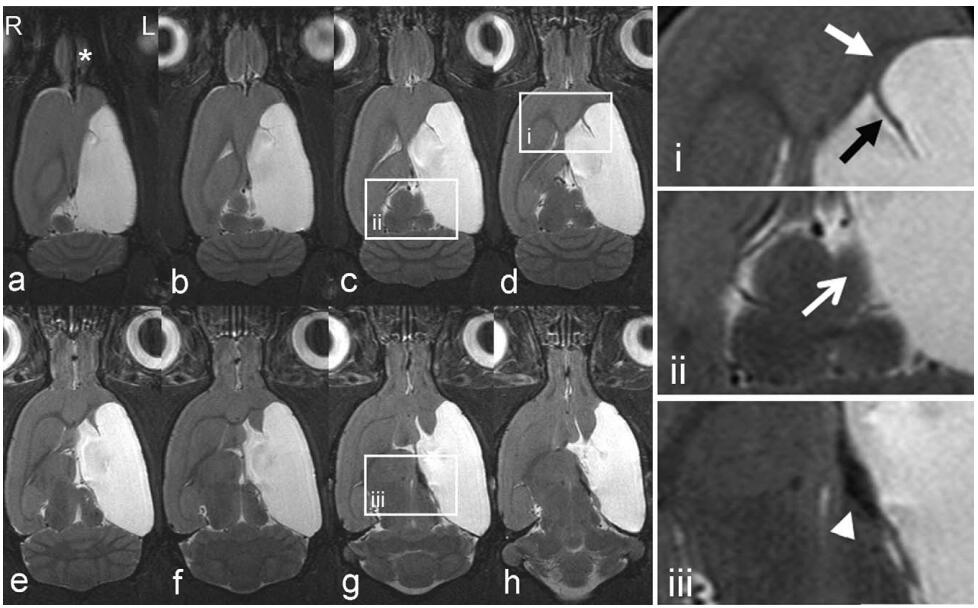
Serial axial T2WIs in dorsal to ventral directions (a–h), and zoomed insets (i–iii) of the representative injured rat brain 10 weeks after hypoxic–ischemic insult. A large porencephalic cyst was presented by hyperintensity covering most of the ipsilateral hemisphere, while the ipsilateral hippocampus apparently disappeared. Shrinkage of ipsilateral olfactory bulb was also observed (asterisk). In the zoomed insets, the ipsilateral external capsule appeared to be split in two branches: the upper branch extending along the lesion towards the frontal cortex (white solid arrow), and the lower branch extruding into the cyst (black solid arrow) (i); shrinkage of the ipsilateral superior and inferior colliculi (open arrow) was observed (ii); hypointensity was found in the thalamus (arrowhead) likely due to iron deposition (iii).
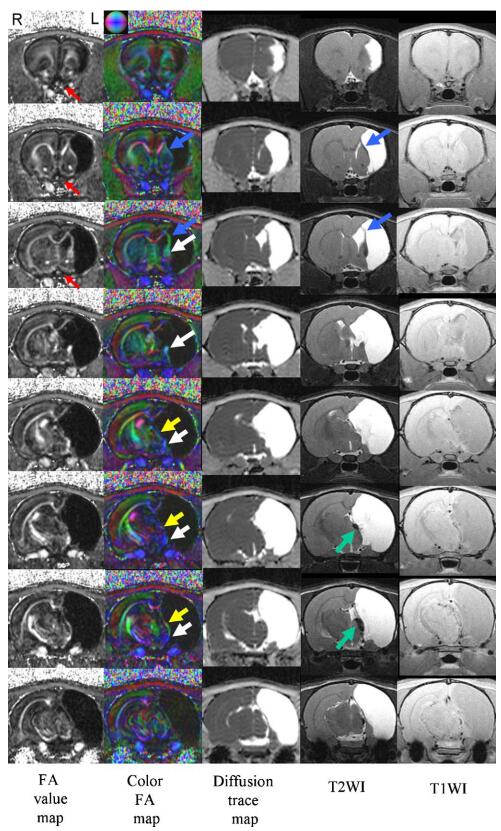
Serial DTI parametric maps (FA value map, color-encoded FA directionality map, and diffusion trace map), T2WI and T1WI in a representative injured rat brain 10 weeks after hypoxic–ischemic insults. The color-encoded FA maps of the principal eigenvector indicated that the high FA fiber bundle along the lesion was extended from the corpus callosum dorsoventrally in the anterior brain (blue arrows) and was connected rostrocaudally to the internal capsule (white arrows). The fibers in peri-infarct areas in the posterior brain had similar directionality to the contralateral internal capsule, optic tract and fimbria of hippocampus (yellow arrows). Note also the shrinkage of ipsilateral optic nerve (red arrows) and the T2W hypointensity in the thalamus (green arrows). (Representative colors for different directions in color-encoded FA directionality map: blue, caudal-rostral; red, left-right; and green, dorsal–ventral).
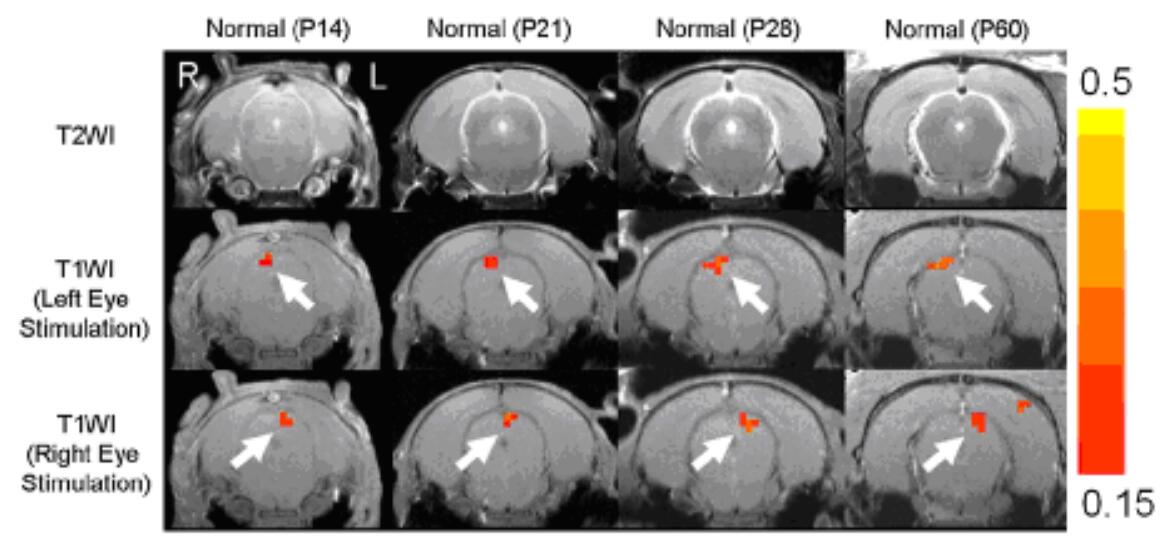
Typical T2WI (top row) and T1WI (middle and bottom rows) of the normal brains at postnatal day P14, P21, P28, and P60 at the level of the superior colliculus (SC). Upon left (middle row) and right (bottom row) eye stimulations, BOLD–fMRI activations were observed in the contralateral SC (arrows) in the cross-correlation (cc) maps overlaid on the T1WI.
Radiation Damage
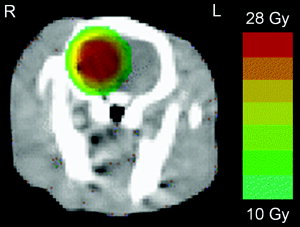
Isodose distribution overlaid on a computed tomographic image of the rat brain. The deposited dose was homogeneous over the right hemisphere in the frontoparietal region, and the dose fell rapidly from 28 Gy to 10 Gy at the beam edge. Note that virtually no irradiation was imposed onto the brain components of interests in the contralateral hemisphere outside the beam edge.
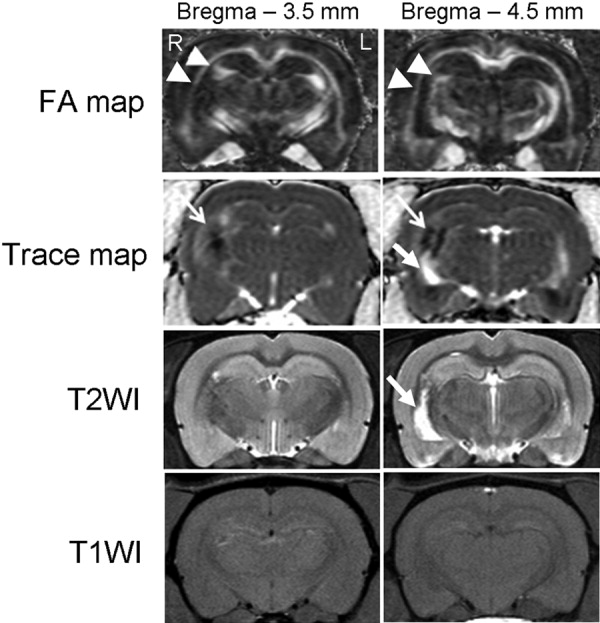
Representative FA and diffusion trace maps, T2WI, and T1WI of the irradiated rat brain at approximately Bregma −3.5 mm and −4.5 mm. Hypointensity was observed in the ipsilateral fimbria of hippocampus and external capsule in the FA map (arrowheads), whereas in the diffusion trace map, hyperintensity was observed surrounding the hypointense radionecrotic core in the frontoparietal region (open arrows). Note also the enlargement and hyperintensity in the ipsilateral lateral ventricle in T2WI and diffusion trace map (solid arrows).
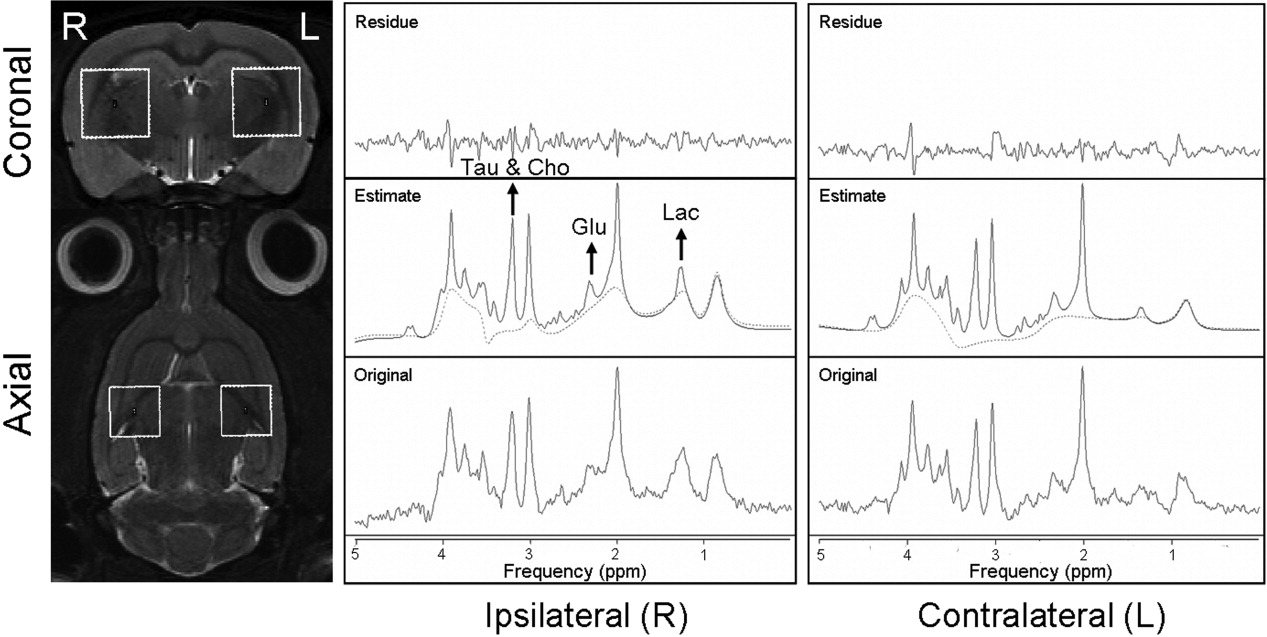
(Left column) Illustration of the localization of the 4 × 4 × 4 mm3 voxels ipsi- (R) and contralateral (L) to the site of irradiation for 1H-MRS. The voxels partially included the thalamus, the hippocampus, its fimbria, and the external and internal capsules. (Middle and right columns) jMRUI QUEST quantitation results of voxels ipsi- and contralateral to the site of irradiation. From top to bottom: residue of QUEST quantitation, estimated spectrum and background signals (dashed line) using QUEST and simulated metabolite basis set signals, and original spectrum. Note the apparent increase in Cho, Glu, Lac, and Tau signals with respect to the Cr signal.