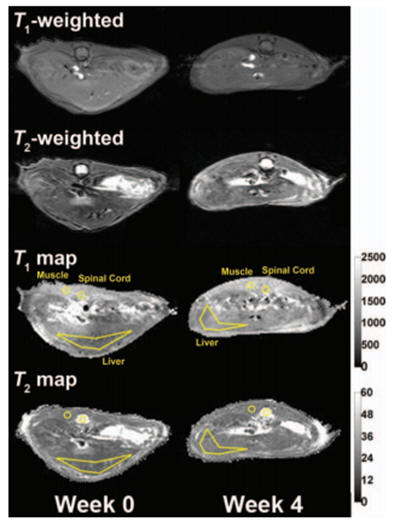
Typical T1- and T2-weighted images, T1 and T2 maps from one animal at 0 and 4 weeks after CCl4 insult. Typical measurement ROIs are shown in T1 and T2 maps.
Sodium Concentration in related to Cell Poliferation
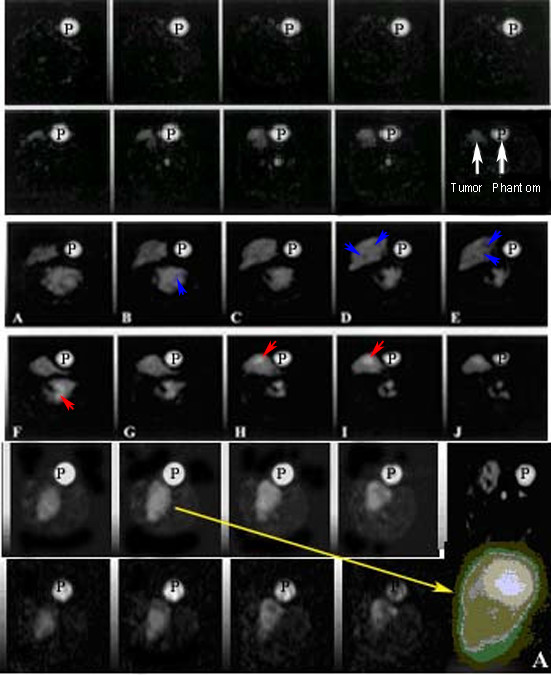
Taxotere chemosensitivity effect is compared on SQ images of pre- and post Taxotere treatment (first vs second rows on top). Panel on second row on rightmost image, represents the tumor SQ image (left arrow) and phantom (right arrow). Third and fourth rows represent the panels showing contrast (arrows) on contiguous intracellular sodium MRI images as "IR" images of pre- and post Taxotere treatment respectively by inversion recovery method. Panels in fifth and sixth rows represent the intracellular sodium signal intensity increases (arrows) in some areas representing active proliferation or resting viable cells. Loss of signal in late apoptosis rich regions and increased tumor areas can be seen as hypointense areas (panels in fifth row vs sixth row for pre- and post-injection of taxotere). An enlarged "IR" image (panel in sixth row) of tumor (on rightmost insert A) after segmentation image processing is shown with different bright, gray and darker pixel signal intensities.
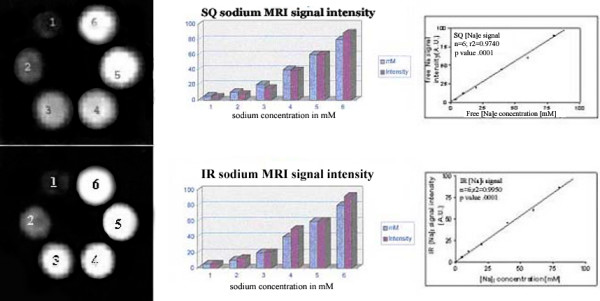
Different 6 concentrations of Na (mM) and their SQ MRI signal intensities are shown in images (left panel) with their relationship as histogram bars and graph (right panels) between sodium concentrations of NaCl solutions and SQ MRI intensities. In second row at bottom, different sodium concentrations and their visibility is shown on left. Histogram bars and graph shows IR sodium MRI signal intensities with different sodium concentrations in 4% agarose.